Hi! We've renamed ScraperWiki.
The product is now QuickCode and the company is The Sensible Code Company.

Archive | Data Science

Book review: Graph Theory and Complex Networks by Maarten van Steen

My last read, on the Gephi graph visualisation package, was a little disappointing but gave me an enthusiasm for Graph Theory. So I picked up one of the books that it recommended: Graph Theory and Complex Networks: An Introduction by Maarten van Steen to learn more. In this context a graph is a collection of […]

Book review: Network Graph Analysis and visualization with Gephi by Ken Cherven

I generally follow the rule that if I haven’t got anything nice to say about something then I shouldn’t say anything at all. Network Graph Analysis and visualization with Gephi by Ken Cherven challenges this principle. Gephi is a system for producing network visualisations, as such it doesn’t have a great many competitors. Fans of […]

Inordinately fond of beetles… reloaded!

Some time ago, in the era before I joined ScraperWiki I had a play with the Science Museums object catalogue. You can see my previous blog post here. It was at a time when I was relatively inexperienced with the Python programming language and had no access to Tableau, the visualisation software. It’s a piece […]

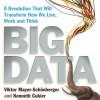
Book review: Big data by Viktor Mayer-Schönberger and Kenneth Cukier

We hear a lot about “Big Data” at ScraperWiki. We’ve always been a bit bemused by the tag since it seems to be used indescriminately. Just what is big data and is there something special I should do with it? Is it even a uniform thing? I’m giving a workshop on data science next week and […]

The history of Pivot table

A pivot table is a spreadsheet feature that allows data tables to be rearranged in many ways for different views of the same data (pivot from one view to another). Pivot Tables have become ubiquitous amongst power users of Excel, even being listed as a skill in CVs and a “desirable” in job specifications – […]

Which GOV.UK department is most mobile?

We recently made 37 dashboards for GOV.UK, full of stats about what people look at on the Government’s website. As you know, the best data opens itself, so I asked myself, what does the underlying data behind these new dashboards secretly reveal? Each dashboard shows the devices people used to access a department. If you mush that together across […]

Book review: Learning SPARQL by Bob DuCharme

The NewsReader project on which we are working at ScraperWiki uses semantic web technology and natural language processing to derive meaning from the news. We are building a simple API to give access to the NewsReader datastore, whose native interface is SPARQL. SPARQL is a SQL-like query language used to access data stored in the […]

The London Underground: Should I walk it?

With a second tube strike scheduled for Tuesday I thought I should provide a useful little tool to help travellers cope! It is not obvious from the tube map but London Underground stations can be surprisingly close together, very well within walking distance. Using this tool, you can select a tube station and the map […]

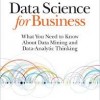
Book review: Data Science for Business by Provost and Fawcett

Marginalia are an insight into the mind of another reader. This struck me as a I read Data Science for Business by Foster Provost and Tom Fawcett. The copy of the book had previously been read by two of my colleagues. One of whom had clearly read the introductory and concluding chapters but not the […]

Visualising the London Underground with Tableau

I’ve always thought of the London Underground as a sort of teleportation system. You enter a portal in one place, and with relatively little effort appeared at a portal in another place. Although in Star Trek our heroes entered a special room and stood well-separated on platforms, rather than packing themselves into metal tubes. I […]

We're hiring!