Three hundred thousand tonnes of gold
On 2 July 2012, the US Government debt to the penny was quoted at $15,888,741,858,820.66. So I wrote this scraper to read the daily US government debt for every day back to 1996. Unfortunately such a large number overflows the double precision floating point notation in the database, and this same number gets expressed as 1.58887418588e+13.
Doesn’t matter for now. Let’s look at the graph over time:
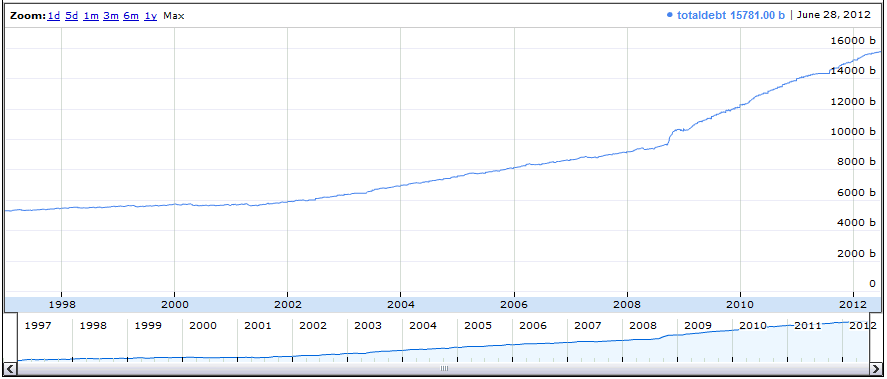
It’s not very exciting, unless you happen to be interested in phrases such as “debasing our fiat currency” and “return to the gold standard”. In truth, one should really divide the values by the GDP, or the national population, or the cumulative inflation over the time period to scale it properly.
Nevertheless, I decided also to look at the gold price, which can be seen as a graph (click the [Graph] button, then [Group Column (x-axis)]: “date” and [Group Column (y-axis)]: “price”) on the Data Hub. They give this dataset the title: Gold Prices in London 1950-2008 (Monthly).
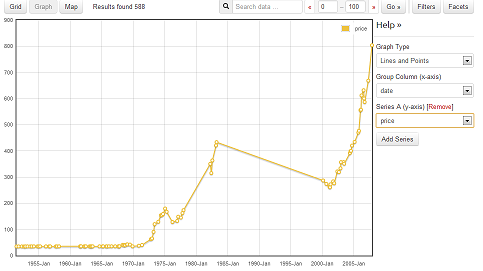
Why does the data stop in 2008 just when things start to get interesting?
I discovered a download url in the metadata for this dataset:
https://raw.github.com/datasets/gold-prices/master/data/data.csv
which is somewhere within the githubtm as part of the repository https://github.com/datasets/gold-prices in which there resides a 60 line Python scraper known as process.py.
Aha, something I can work with! I cut-and-pasted the code into ScraperWiki as scrapers/gold_prices and tried to run it. Obviously it didn’t work as-is — code always requires some fiddling about when it is transplanted into an alien environment. The module contained three functions: download(), extract() and upload().
The download() function didn’t work because it tries to pull from the broken link:
http://www.bundesbank.de/statistik/statistik_zeitreihen_download.en.php?func=directcsv&from=&until=&filename=bbk_WU5500&csvformat=en&euro=mixed&tr=WU5500
This is one of unavoidable failures that can befall a webscraper, and was one of the motivations for hosting code in a wiki so that such problems can be trivially corrected without an hour of labour checking out the code in someone else’s favourite version control system, setting up the environment, trying to install all the dependent modules, and usually failing to get it to work if you happen to use Windows like me.
After some looking around on the Bundesbank website, I found the Time_series_databases (Click on [Open all] and search for “gold”.) There’s Yearly average, Monthly average and Daily rates. Clearly the latter is the one to go for as the other rates are averages and likely to be derivations of the primary day rate value.
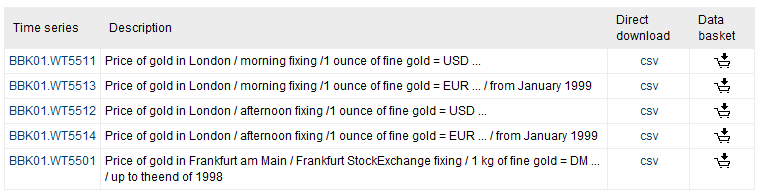
I wonder what a “Data basket” is.
Anyways, moving on. Taking the first CSV link and inserting it into that process.py code hits a snag in the extract() function:
downloaded = 'cache/bbk_WU5500.csv'
outpath = 'data/data.csv'
def extract():
    reader = csv.reader(open(downloaded))
    # trim junk from files
    newrows = [ [row[0], row[1]] for row in list(reader)[5:-1] ]

    existing = []
    if os.path.exists(outpath):
        existing = [ row for row in csv.reader(open(outpath)) ]

    starter = newrows[0]
    for idx,row in enumerate(existing):
        if row[0] == starter[0]:
            del existing[idx:]
            break

    # and now add in new data
    outrows = existing + newrows
    csv.writer(open(outpath, 'w')).writerows(outrows)
ScraperWiki doesn’t have persistent files, and in this case they’re not helpful because all these lines of code are basically replicating the scraperwiki.sqlite.save() features through use of the following two lines:
    ldata = [ { "date":row[0], "value":float(row[1]) }  for row in newrows  if row[1] != '.' ]
    scraperwiki.sqlite.save(["date"], ldata)
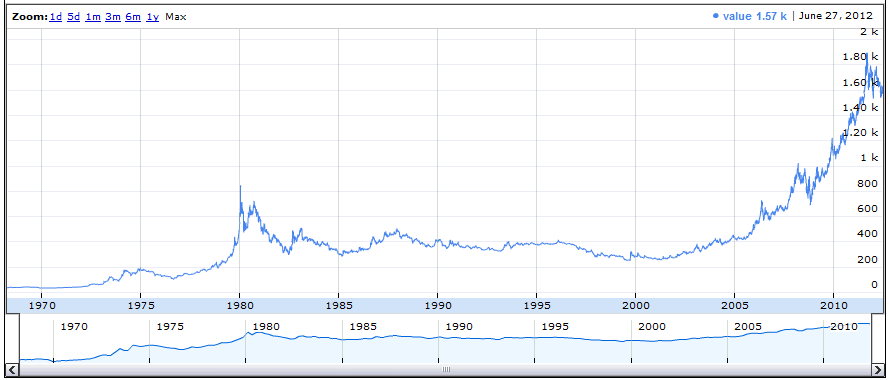
And now your always-up-to-date gold price graph is yours to have at the cost of select date, value from swdata order by date –> google annotatedtimeline.
But back to the naked github disclosed code. Without its own convenient database.save feature, this script must use its own upload() function.
def upload():
    import datastore.client as c
    dsurl = 'http://datahub.io/dataset/gold-prices/resource/b9aae52b-b082-4159-b46f-7bb9c158d013'
    client = c.DataStoreClient(dsurl)
    client.delete()
    client.upload(outpath)
Ah, we have another problem: a dependency on the undeclared datastore.client library, which was probably so seamlessly available to the author on his own computer that he didn’t notice its requirement when he committed the code to the github where it could not be reused without this library. The library datastore.client is not available in the github/datasets account; but you can find it in the completely different github/okfn account.
I tried calling this client.py code by cut-and-pasting it into the ScraperWiki scraper, and it did something strange that looked like it was uploading the data to somewhere, but I can’t work out what’s happened. Not to worry. I’m sure someone will let me know what happened when they find a dataset somewhere that is inexplicably more up to date than it used to be.
But back to the point. Using the awesome power of our genuine data-hub system we can take the us_debt_to_the_penny, and attach the gold_prices database to perform the combined query to scales ounces of gold into tonnes:
SELECT
  debt.date,
  debt.totaldebt/gold.value*2.83495231e-5
    AS debt_gold_tonnes
FROM swdata AS debt
LEFT JOIN gold_prices.swdata as gold
  ON gold.date = debt.date
WHERE gold.date is not null
ORDER BY debt.date
and get the graph of US government debt expressed in terms of tonnes of gold.
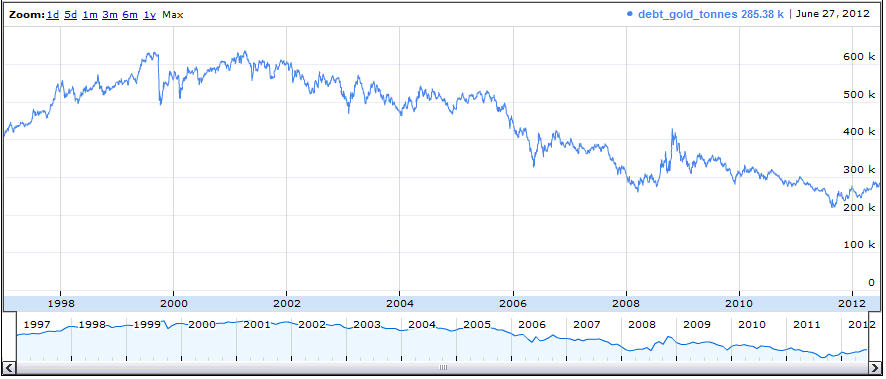
So that looks like good news for all the gold-bugs, the US government debt in the hard currency of gold has been going steadily down by a factor of two since 2001 to around 280 thousand tonnes. The only problem with that there’s only 164 thousand tonnes of gold in the world according to the latest estimates.
Other fun charts people find interesting such as gold to oil ratio can be done once the relevant data series is loaded and made available for joining.
What are you using to generate the charts? It looks like the same library Google uses in Google finance.
Yep, it’s the google annotated timeline widget:
https://developers.google.com/chart/interactive/docs/gallery/annotatedtimeline
For future ref the datastore client is uploading to a CKAN datastore, unless you provide it details of which it is probably failing.