Worked example
Explaining recipe a02.py
The spreadsheet we're going to extract data from is a02.xls. It's
available here together
with the recipe a02.py which we're going to walk through
step-by-step in this tutorial.
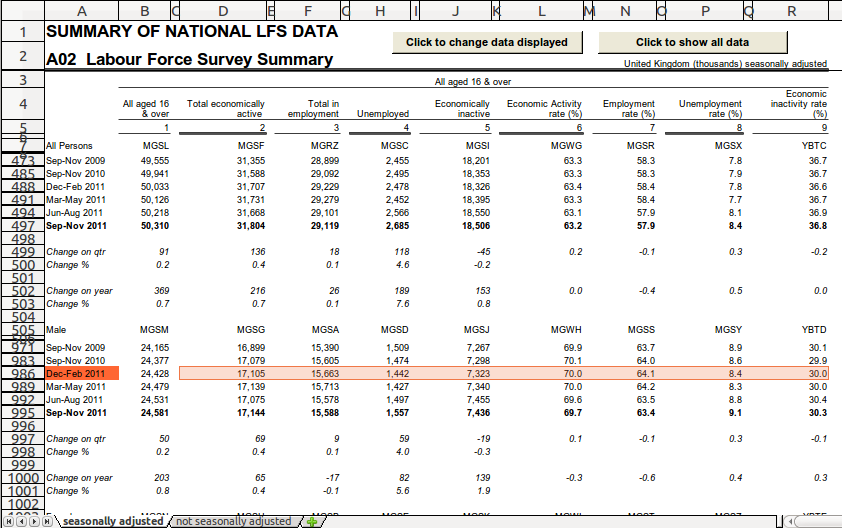
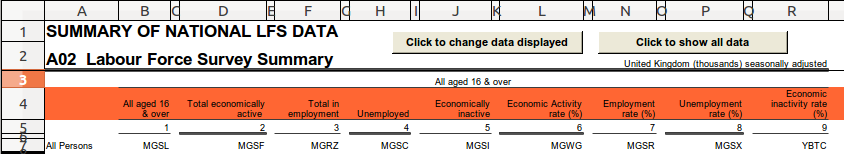
A snippet of the spreadsheet is shown below:
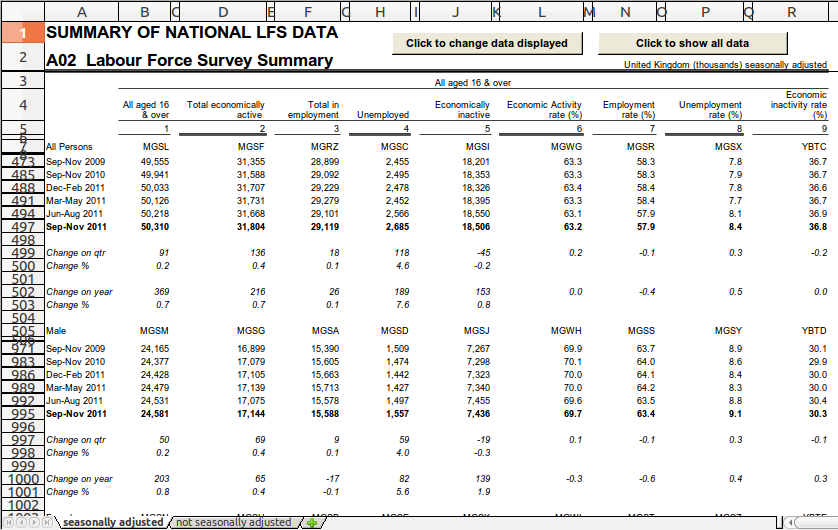
We want to extract all the observations from the tabs, except the combined "all aged 16 & over" data. The change data aren't observations so we should ignore these too.
We can run the recipe by placing a02.py in the same directory as a02.xls
and running bake a02.py a02.xls while in that directory at the Windows
command line.
Importing constants
from databaker.constants import *
This line makes it possible to use any of the following in the recipe:
- dimensions (
DATAMARKER,GEOG,OBS,TIME,TIMEUNIT); - directions (
ABOVE,BELOW,LEFT,RIGHT); - selection specifiers (
CLOSEST,DIRECTLY).
Without them, the recipe will fail with a "NameError" as the recipe
doesn't know how these special constants are defined.
per_file
def per_file(tableset):
    return "*"
This selects all of the spreadsheet tabs: we will extract
data from both the seasonally adjusted and the not seasonally
adjusted tabs.
For this spreadsheet, the tab layouts are similar enough that we can use the same recipe code for all the tabs.
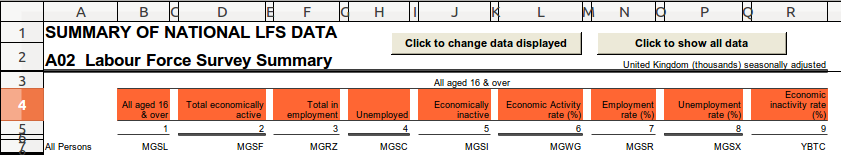
per_tab
def per_tab(tab):
    obs = tab.filter("MGSL").assert_one().shift(DOWN).fill(RIGHT).fill(DOWN).is_number().is_not_italic()
    tab.col('A').one_of(['Male', 'Female', 'All Persons']).dimension('gender', CLOSEST, ABOVE)
    tab.col('A').is_date().dimension(TIME, DIRECTLY, LEFT)
    tab.regex("All aged .*").dimension('ages', CLOSEST, UP)
    tab.filter("Total economically active").fill(LEFT).fill(RIGHT).is_not_blank().dimension('indicator', DIRECTLY, ABOVE)
    tab.dimension('adjusted_yn', tab.name)
    return obs
For each tab we've selected, per_tab does the following things.
Selecting cells
Line 1
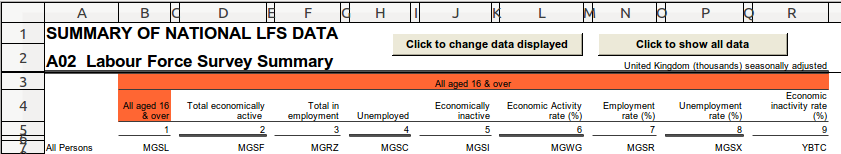
tab.filter("MGSL")
This only returns cells that match the text "MGSL". In this spreadsheet, there's only one match at cell B7, so this filter returns this cell.
We can confirm this by then doing .assert_one(). Why do this if we
already know there's only one cell that matches? It means that we can
reuse this recipe on new version of the spreadsheets but have it warn us
if it finds multiple entries — or none at all. It's possible that
whoever creates the next version of the spreadsheet might, for instance,
merge the two tabs into one. assert_one() would warn us of this.
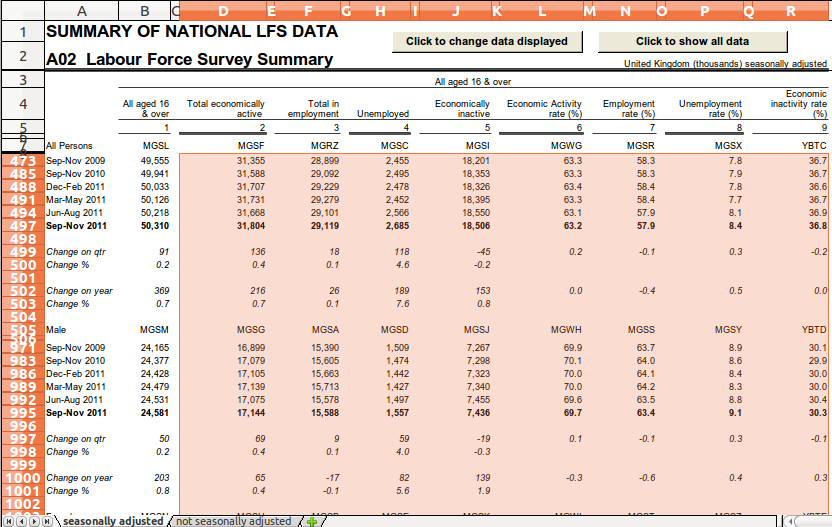
From cell B7, shift(DOWN) now gives us the one cell down from the one that
contained MGSL, so we've now selected cell B8.
fill(RIGHT) and fill(DOWN) then select all cells to the right and down of
cell B8, so we skip that first header row and the first column.
The image below shows us the selection at this stage:
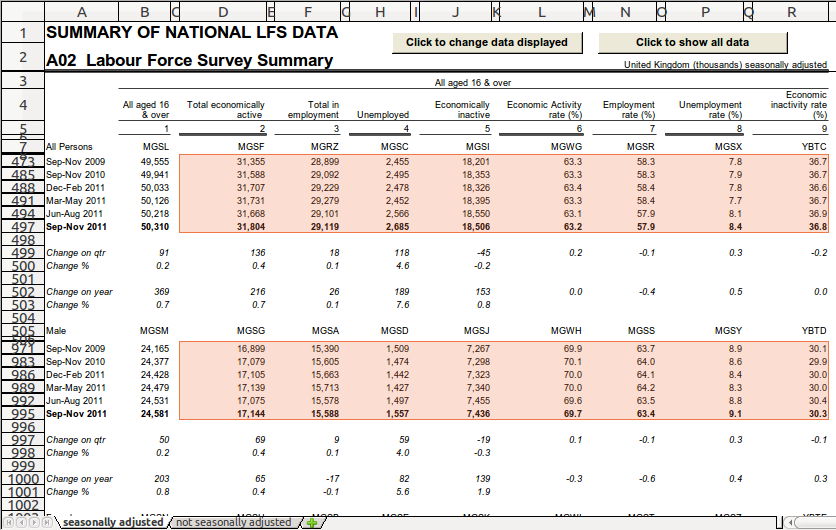
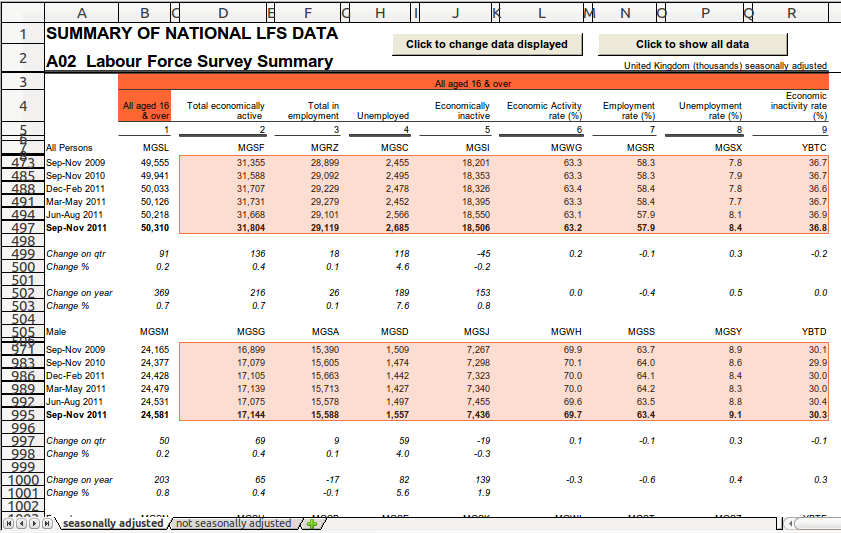
Now we've selected the cells that are to the right and down of B7 which contain the data we want. But, we're only interested in the observations, so we don't want to extract the four character codes or the change values.
The character codes are easily distinguished from the observations as they are text, not numbers. And the change values are in italics.
So, we can use is_number() and is_not_italic() to get only the
observation cells.
Below illustrates the selection we've made:
These selected cells are stored in a variable called obs.
Specifying the dimensions
For each observation, we want to add certain dimensions. The following lines specify which dimensions we will retrieve for each observation.
tab.col('A').one_of(['Male', 'Female', 'All Persons']).dimension('gender', CLOSEST, ABOVE)
tab.col('A').is_date().dimension(TIME, DIRECTLY, LEFT)
tab.regex("All aged .*").dimension('ages', CLOSEST, UP)
tab.filter("Total economically active").fill(LEFT).fill(RIGHT).is_not_blank().dimension('indicator', DIRECTLY, ABOVE)
Here, the dimensions that we want to retrieve for each cell in obs are
themselves specified by the contents of cells.
These four lines all add dimensions to be retrieved for each cell in the
selected data, obs, but use different approaches to locate the cell
containing the dimension information.
Line 2
The tab.col('A') in line 2 (L2) and line 3 selects cells in column A
of the tab.
Next, of the cells in column A, one_of selects those that match the
text Male, Female or All Persons.
.dimension('gender', CLOSEST, ABOVE) specifies what we want to call
the dimension in the output — "gender" — along with how we get to the
gender cell that corresponds to an observation cell.
We look for the CLOSEST cell of this selection that's ABOVE the row
where the observation lies.
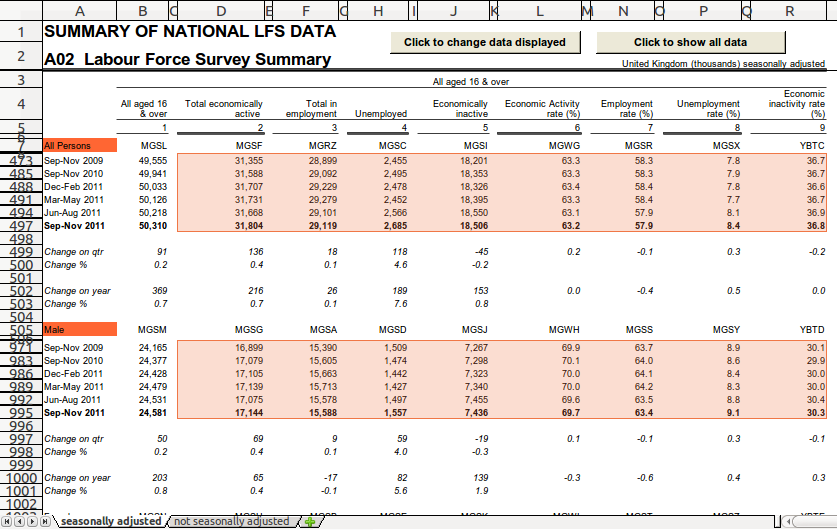
This is illustrated below. The solid orange cells are the gender cells
that we selected in this line of the recipe. The light orange selection
represent cells in obs. For any cell in the first selection of obs
cells (rows 473-497), the closest above gender dimension is "All
Persons". For cells in the second selection of obs cells (rows
971-995), the closest above gender dimension is "Male".
Line 3
First, we do the same as in L2, selecting all cells in column A.
This time we're looking for cells containing a date, which we select
using is_date().
.dimension(TIME, DIRECTLY, LEFT)
We then specify that this corresponds to the special TIME dimension and
that this data lies DIRECTLY to the left of the current cell.
Below we show an example of this again. For this one particular row of
obs cells shown, the dimension we select for each cell in the row directly
left date to each of those cells is Dec-Feb 2011. (Each row of obs
cells likewise has a corresponding date that will be stored for each
observation.)
Line 4
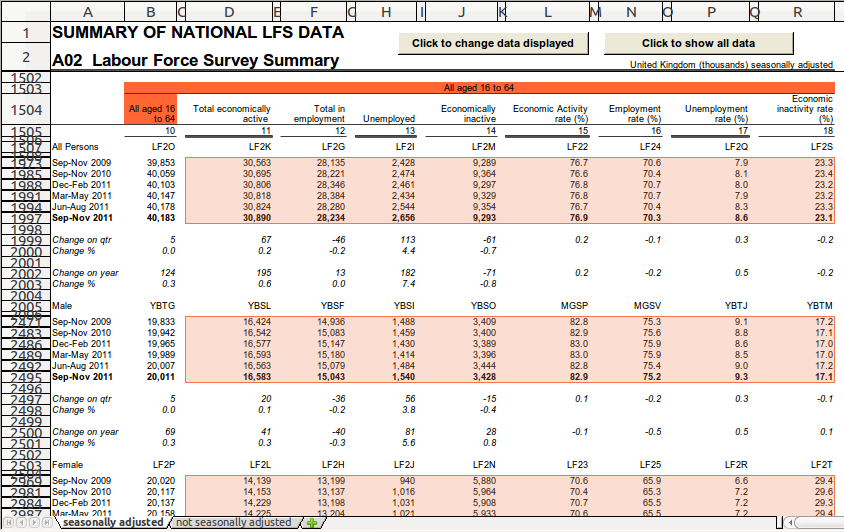
tab.regex("All aged .\*") uses a regular expression to find cells
anywhere in the tab that contain All aged (notice the space) followed
by any text.
Selected cells are shown below highlighted orange:
The .* means match any character (represented by .) and we've specified
using the * that we don't mind how many characters follow All aged.
This way we match the cells in the spreadsheet that
contain All aged 16 & over and All aged 16 to 64.
.dimension('ages', CLOSEST, UP) labels this dimension as ages and
specifies that we want the closest cell above. So we're again finding
the closest cell to each one in our selection.
(UP and ABOVE mean the same thing.)
In the case below, the CLOSEST matching dimension cell UP from any selected
cell in obs as shown is B4.
(Note that the examples in the images are truncated forms of the full
spreadsheets. In the full spreadsheet, the cell All aged 16 to 64 also
matches this age regex. The selected obs cells that are below this
"All aged 16 to 64" cell will actually have that as their corresponding
dimension, as that cell would be the CLOSEST UP from them, closer than
the All aged 16 & over.)
Line 5
tab.filter("Total economically active").fill(LEFT).fill(RIGHT).is_not_blank().dimension('indicator', DIRECTLY, ABOVE)
Here we first find cells that contain exactly Total economically
active. For all of the cells in this selection, we then select all cells
to the left and right of these with .fill(LEFT) and .fill(RIGHT):
As shown, this also includes lots of blank cells, those to either side of the headers as well as the empty cells between headers (e.g. C4, E4...)
The image below shows the effect of is_not_blank(): it removes these
unwanted and empty cells.
.dimension('indicator', DIRECTLY, ABOVE) labels the cell in this
selection directly above each cell of interest as indicator.
Line 6
tab.dimension('adjusted_yn', tab.name)
This line explicitly sets a dimension item to be the name of the
current tab (tab.name). It doesn't actually consider any of the
cells in the spreadsheet at all.
This only works for text which doesn't depend on the particular observation — so typically things which are the same for all observations on the tab.
So, for this dimension, the values will be
seasonally adjusted or not seasonally adjusted depending on which
tab the observation was found.
Extracting the data with the dimensions
Line 7
return obs then tells databaker that it's the end of the recipe
and we've finished selecting observations and dimensions. If we run
this recipe, the output data will be generated containing the
observations and dimensions we've chosen in it.