Recipe overview
Example recipe
The recipes are written in a special language. They look like this:
from databaker.constants import *
def per_file(tableset):
return tableset
def per_tab(tab):
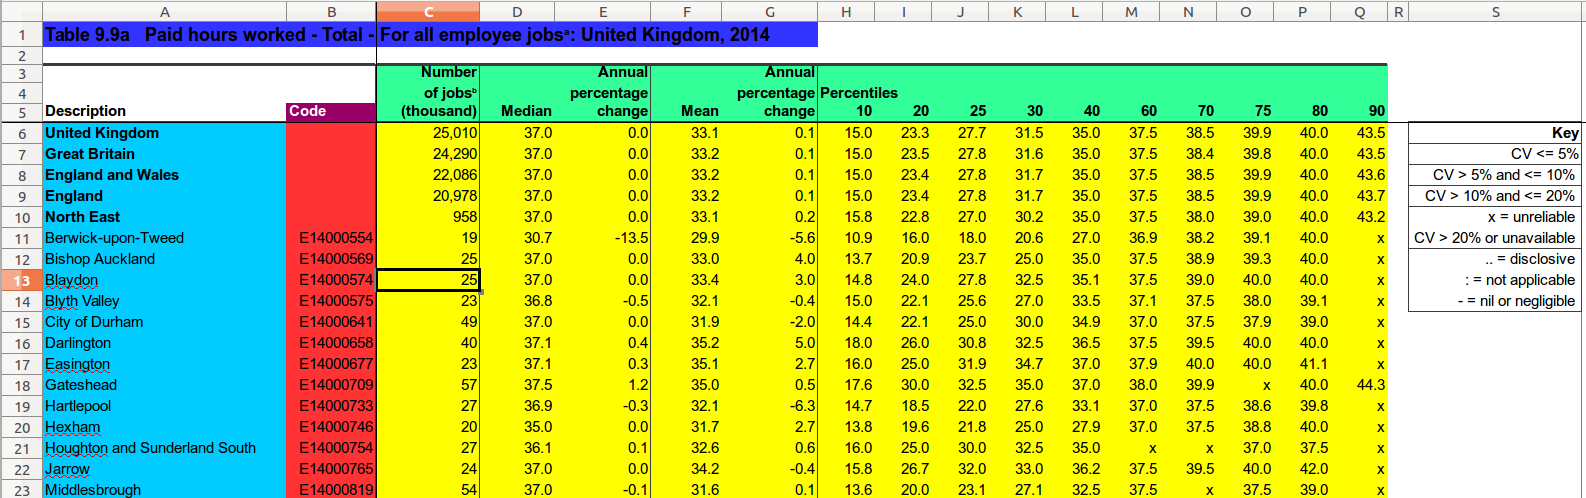
obs = tab.filter("MGSL").assert_one().shift(DOWN).fill(RIGHT).fill(DOWN).is_number().is_not_italic()
tab.col('A').one_of(['Male', 'Female', 'All Persons']).dimension('gender', CLOSEST, ABOVE)
tab.col('A').is_date().dimension(TIME, DIRECTLY, LEFT)
tab.regex("All aged .*").dimension('ages', CLOSEST, ABOVE)
tab.filter("Total economically active").fill(LEFT).fill(RIGHT).is_not_blank().dimension('indicator_', DIRECTLY, ABOVE)
return obs
You can just edit or copy recipes to make basic changes. If you need to do anything more complicated, it is worth knowing they are written in the Python programming language. There's lots of online help and training for Python.
Header line
from databaker.constants import *
This is just boilerplate: it needs to be at the start of each file.
Per File
def per_file(tableset):
    ...
    return wanted_sheets
Here we say which tabs in the Excel spreadsheet we're interested in.
Options include:
- Explicit names of tables as strings
def per_file(tabs):
    return "My Table"                    # one table called 'My Table'
    # or
    return ["This Table", "That Table"]  # two tables with specific names
    # or
    return "*"                           # all tables
- Using a list of table names to inform decisions:
def per_file(tabs):
    tablist = tabs.names         # get a list of names
    tablist.discard('Notes')     # remove names from list
    tablist.discard('CV notes')
    return tablist
- Returning the tables themselves
def per_file(tabs):
    return tabs  # all tables
This last one is potentially useful for selecting tables based on the contents of their cells:
def per_file(tabs):
    for tab in tabs:
        if tab.excel_ref("A1").value == '2015':
            yield tab
Per Tab
def per_tab(tab):
    ....
    return observations
As sugggested by the name, this code is run for every tab in the spreadsheet. It needs to return the observations and tell the tab which cells are which headers.
These are done with:
def per_tab(tab):
    tab.dimension('table_header', selector().value)  # get text describing sheet - dark blue
    tab.selector().dimension(GEOG, DIRECTLY, LEFT)  # places - red
    tab.selector().dimension('top_header', DIRECTLY, ABOVE)  # what the number is - green
    obs = tab.selector()  # observations - yellow
    return obs
(in this example, selector() isn't an actual databaker function. It's
a placeholder for functions that pick relevant cells, e.g. fill(RIGHT)
or .is_not_italic(). For real selectors, see the
function reference.
You can return multiple segments by using yield. This will lead to the previous headers being wiped; you can use variables to avoid having to recalculate the unchanged headers.
The output probably won't be in the correct order, however: each tab is processed in turn, rather than each segment. You can use sortcsv --ons <csvfile> to change the file in-place.
.dimension(name, string)
For dimensions that are the same for all observations on a tab, a literal string can be used. (This might be tab.name, the name of the tab, or a selector which selects a single cell followed by .value)
.dimension(name, method, direction)
For dimensions where the value for a particular observation is in a single cell, we need to say how to get from the observations to the headers: we need to specify whether we stay in the same column or row (DIRECTLY) or just need to get the closest in that direction, regardless (CLOSEST). (Where it isn't, see .subdimension)
The region examined for headers typically includes the row/column the observation is in.
Note how DIRECTLY vs CLOSEST changes which cell is selected:
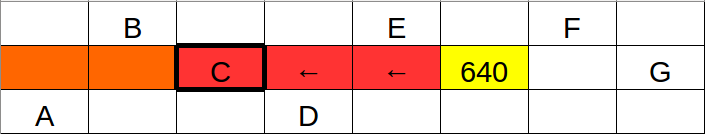
[above: DIRECTLY, LEFT]
[above: CLOSEST, LEFT]
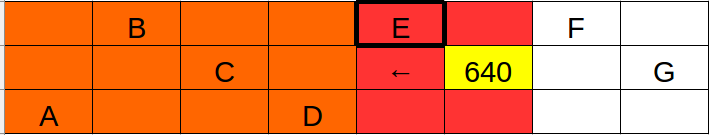
This does lead to slightly counterintuitive behaviour when selecting DIRECTLY and CLOSEST cells which are off in one direction from the observations.
For the table below, we'd look for lowercase letters using DIRECTLY, LEFT, but for the uppercase letters with CLOSEST, ABOVE.
[above: to look DIRECTLY in the same row, you need the closest cell to the LEFT]
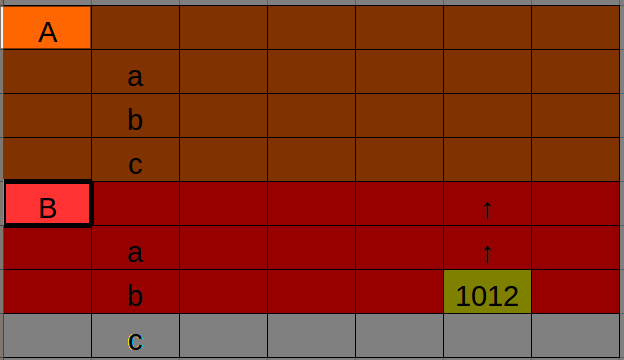
[above: whereas the CLOSEST is found at the closest relevant cell ABOVE it]
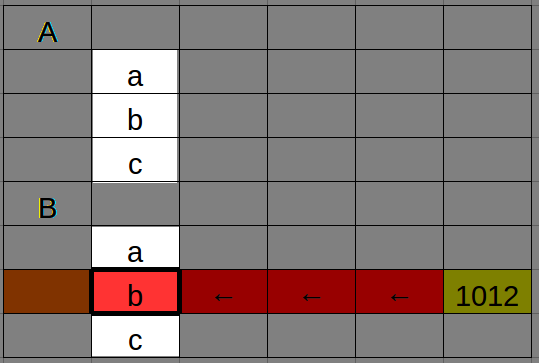
.dimension(name, [subdimensions])
Sometimes the value of the dimension isn't all in the same cell: the TIME for the cell below should be "2012 Q3" but they're in different cells.
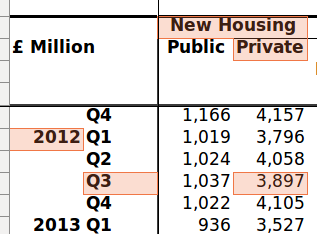
We need subdimensions to pick out the different locations for the text. (We can't .glue the cells together since we need the year in multiple places)
This would look like:
tab.dimension(DATE, [years.subdim(CLOSEST, ABOVE),
                     quarters.subdim(DIRECTLY, LEFT)])
Note that subdimensions are exactly the same as normal dimensions except:
- use
.subdiminstead of.dimension - they don't have a label (i.e. their first parameter isn't
YEARor a column name) - they don't appear independently in the CSV output, only joined together.
- they're not chainable:
.subdim()doesn't return a bag.
For example, `tab.subdim('literal string') is also a valid subdimension.
Theoretically this might mean you can nest subdimensions, but this hasn't been tested.
There is also an optional join_function parameter which controls how the subdimension values are concatenated. By default this inserts a space between each pair (i.e. join_function = ' '.join).
Special dimensions
Dimensions such as DATAMARKER, TIME, TIMEUNIT and GEOG have special places in the output CSV format.
Dimensions which are strings are appended to the end of each row in order.
DATAMARKER
If an observation isn't a number, DATAMARKER is automatically populated with the value instead, and the observation field is left empty.
This won't happen if the DATAMARKER field isn't blank; you'll get a warning instead.
TIME and TIMEUNIT
TIMEUNIT is automatically populated if TIME contains a well-formatted date-string. (Doesn't work on Excel date-formatted items, yet. Yell if that's a problem.)
Well formatted date string examples: 2000 (Year); 2000 Q1 and Jan-Mar 2000 (Quarter); Jan 2000 (Month).
Others
STATPOP, GEOG, UNITOFMEASURE, UNITMULTIPLIER, MEASURETYPE, and STATUNIT have no special properties above going in particular columns in the output.